

Navigate data models
A data model consists of two pages: a workbook page and an overview page. The workbook page allows you to create and transform reusable elements to build your data model, while the overview page provides context about the data model and general usage across your organization. Within the overview page, you can also access metadata to gain key insights into your data structure, quality, and lineage.
This document explains the structure and content of the workbook page and overview page to help you navigate data models.
Data model workbook page
The workbook page enables you to create and manage various tables and input tables as reusable elements within a single data model. This format brings the ease and flexibility of Sigma’s workbook structure to data model development. Consolidate and transform your data as you would in a workbook analysis, and control which elements can be reused as data sources across your organization.
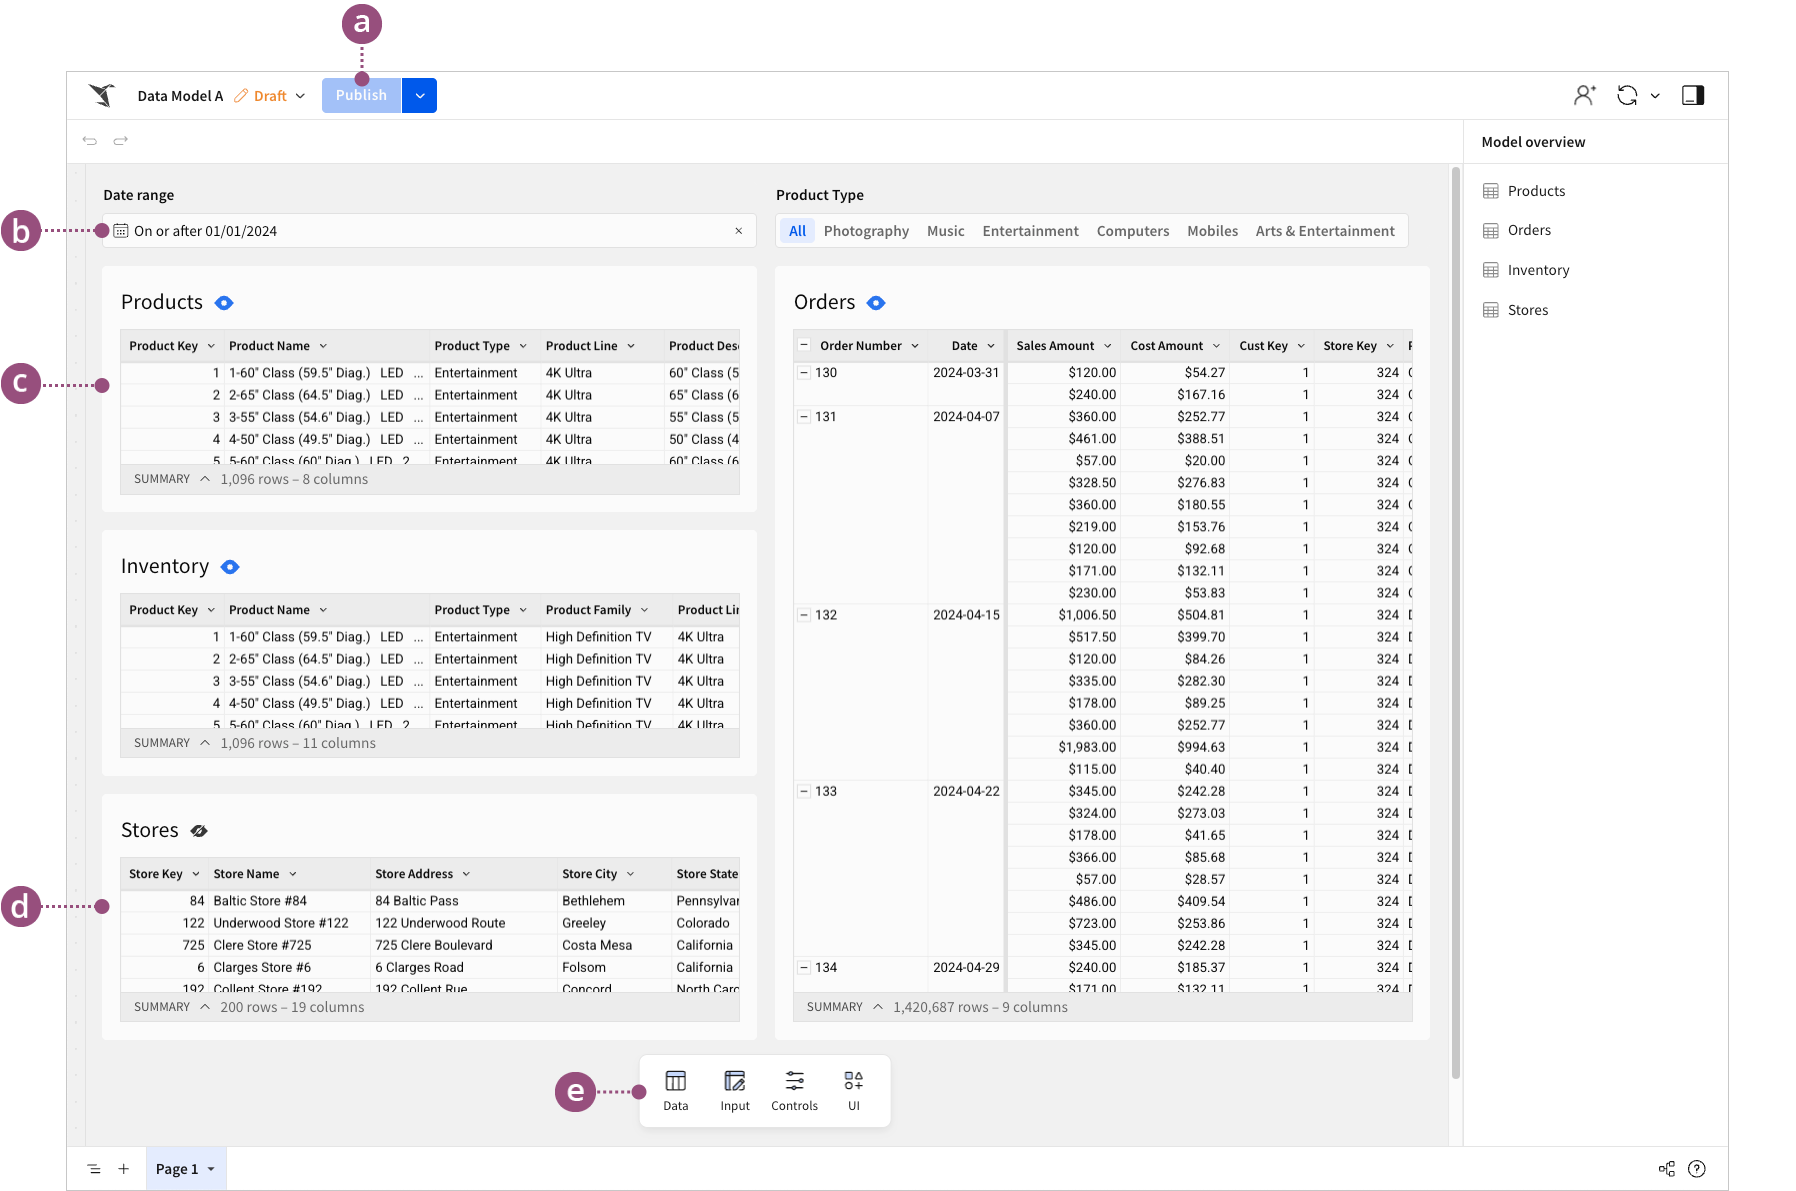


Data model overview page
The overview page provides details about each reusable element in the data model for improved data visibility and management.
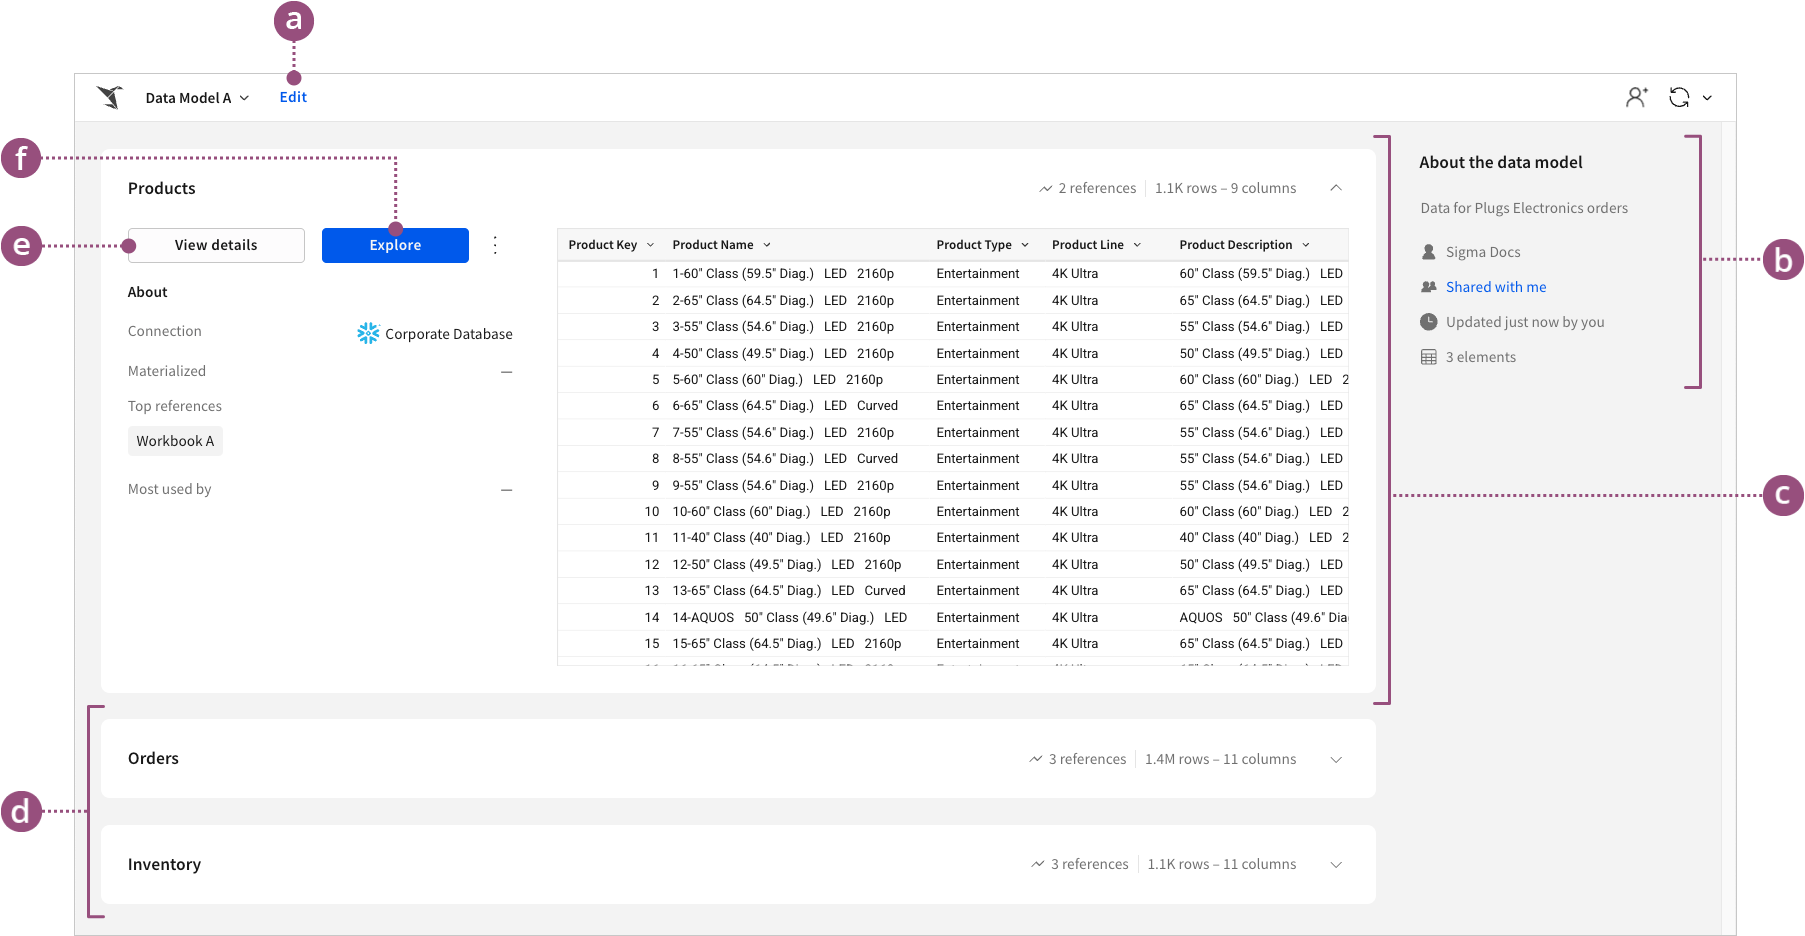
Data details
The details view on the overview page provides access to metadata for individual reusable elements in the data model, revealing important insights for data profiling and lineage tracking.
Columns
The Columns tab includes structural metadata (column name, data type, format, and description) and system-generated statistics that can help you assess data quality, distribution, and variability. With this information, you can better understand your data, identify potential issues, and improve data usability.
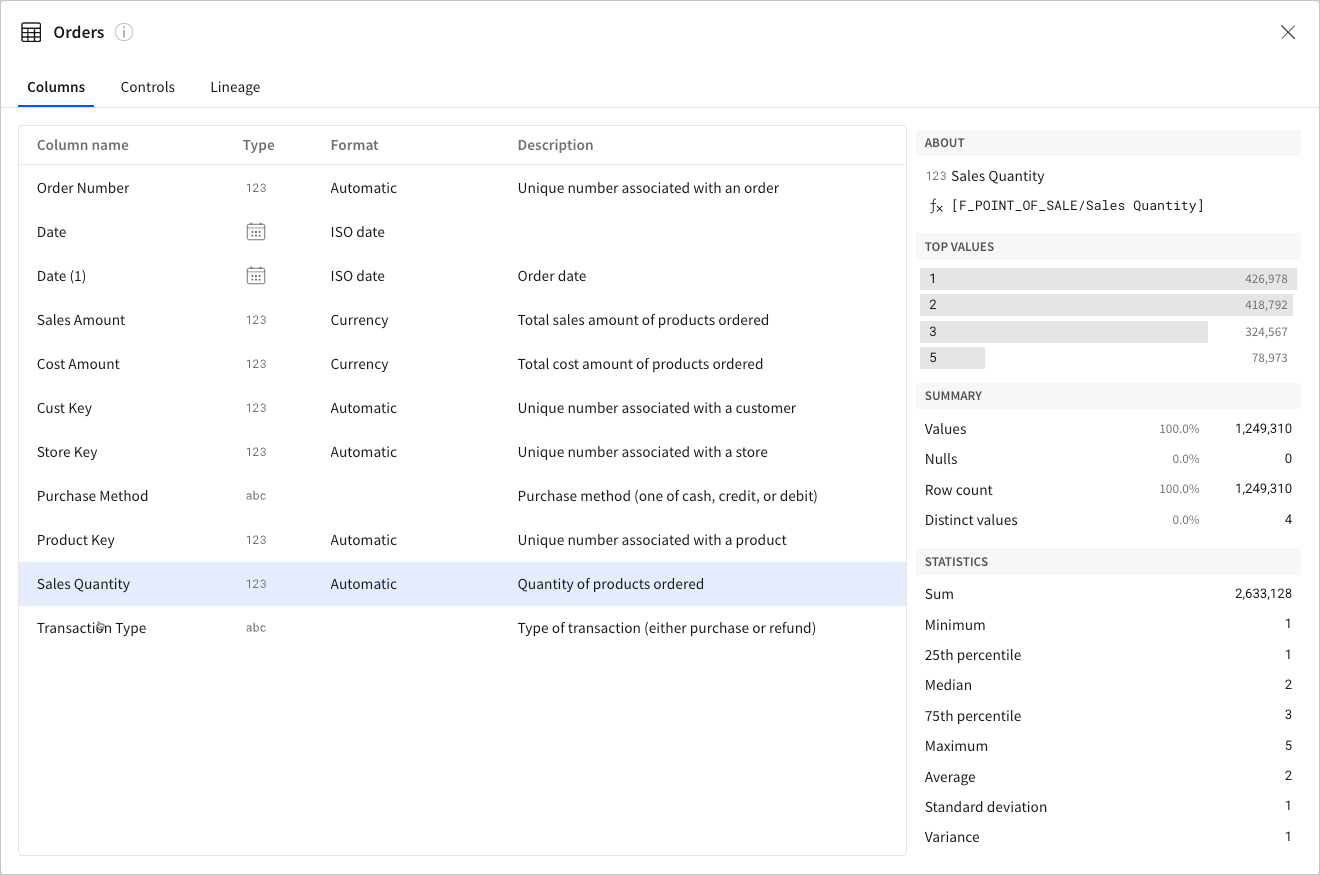
Example insights from system-generated statistics:
- A high percentage of nulls suggests there are missing values and incomplete data.
- A low percentage of distinct values can indicate duplicate records causing unexpected data redundancy.
- Minimum and maximum values represent the data range, which can reveal outliers from possible data entry errors.
- A high standard deviation can be evidence of anomalies contributing to data inconsistency.
Controls
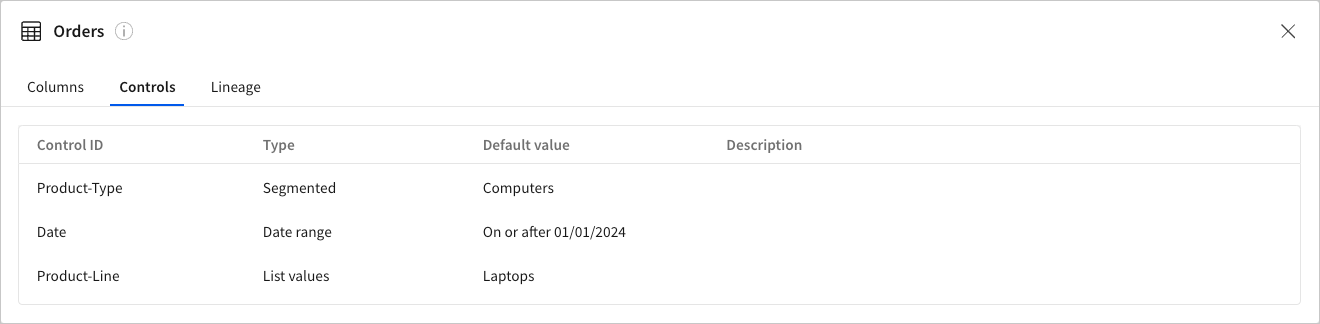
The Controls tab lists information about the controls applied to the reusable element. This data transparency can help users understand how the data is filtered and transformed within the data model.
Lineage
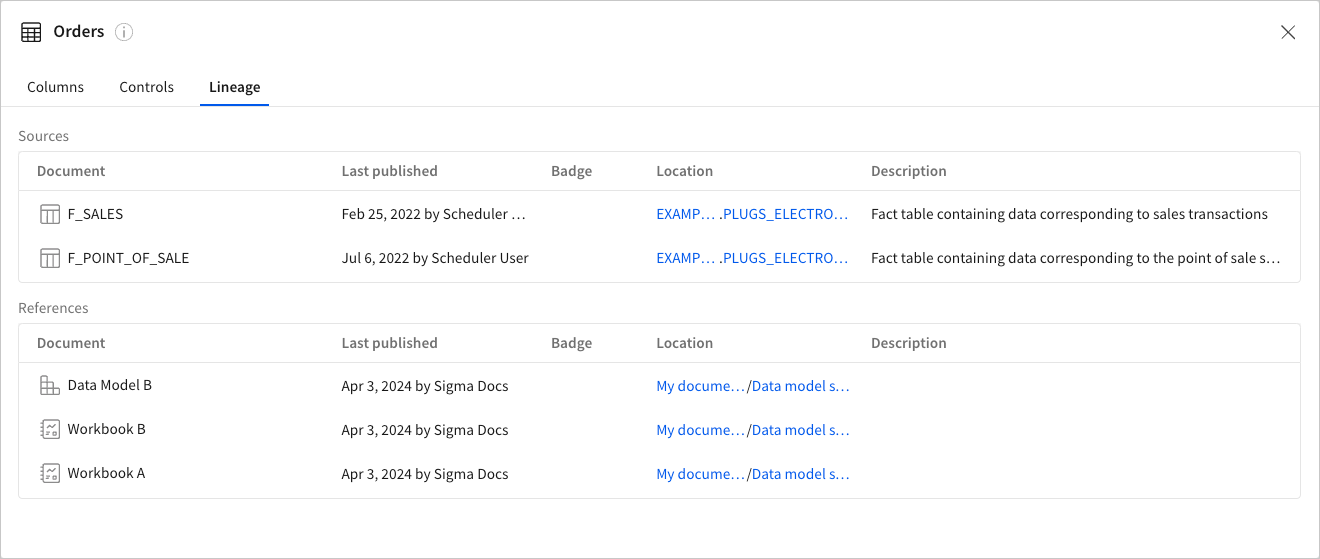
The Lineage tab provides details about the reusable element’s data sources and references (downstream dependencies), allowing users to identify where the data originates from and where it’s used across your organization.
Explore highlighted metrics
If your data model contains metrics, up to 6 metrics display on the data model overview page. Users with edit access to the data model can choose which metrics to highlight, but anyone with access to the data model can explore the highlighted metrics.
To review details about a highlighted metric, open the data model and select a highlighted metric. A detailed profile page for the metric opens:
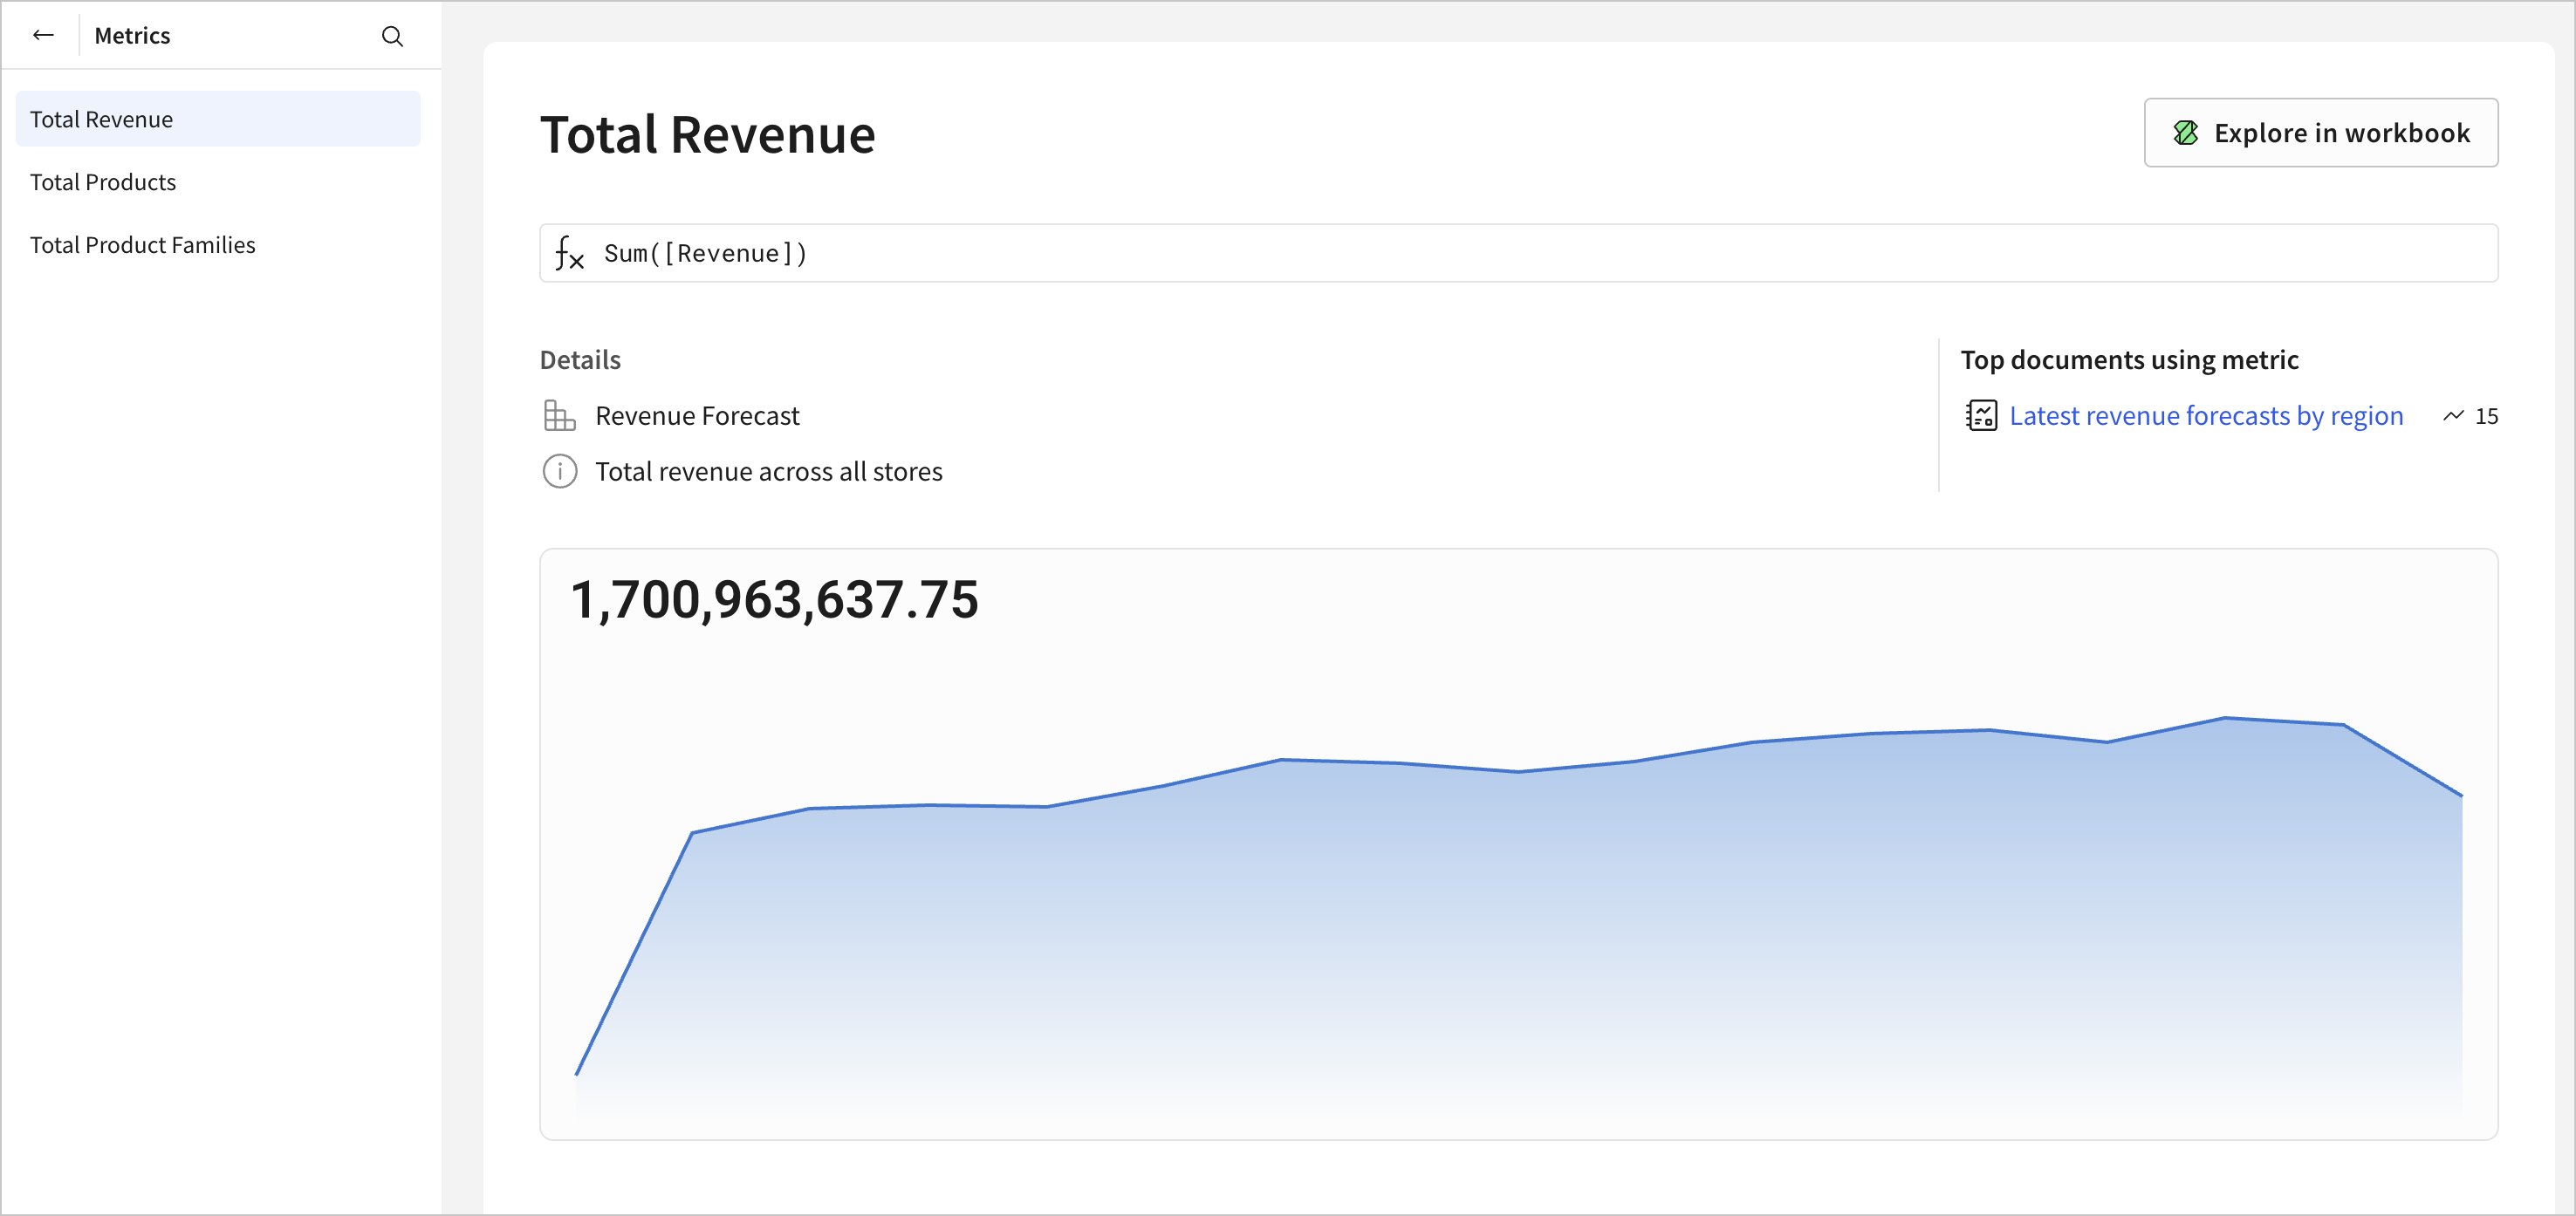
For each metric defined in the data model, you can review the following:
- The metric name and formula.
- The name of the data model element that contains the metric.
- The description of the metric.
- Top documents using the metric. Click the document name to open the document in the same browser tab.
- If the metric has a timeline enabled, explore the timeline and KPI chart for the metric.
Select Explore in workbook to open a new workbook with the metric as a KPI chart.