

Display chart reference marks
Reference marks visually highlight important information about charts, including averages, medians, minimum and maximum values, custom values, and formulas. You can configure them to appear as either lines or bands.
Reference lines and reference bands are available for the following visualization types:
User requirements
- To customize a chart in a workbook, you must be assigned an account type with Full explore or Create, edit, and publish workbooks permission enabled.
- To customize a chart in a report, you must be assigned an account type with the Create, edit, and publish reports permission enabled.
- You must be the document owner or be granted Can explore or Can edit access to the document.
Add a reference line
A reference line marks a single value on a chart, such as a target, threshold, or average.
To plot a reference line, do the following:
-
Open a workbook or report for customizing or editing.
-
Select the chart you want to modify.
-
In the editor panel, select Format, then click Reference marks to expand the section.
-
Click + Add new.
-
For Line or band, select Line.
-
For Axis, select the axis you want to plot the line on.
-
For Value, configure the location of the reference line:
- To use a fixed value, select Constant and enter the value you want to use.
- To calculate the value from your data, select an aggregate, such as Min, Max, Sum, or Avg, then select a column to aggregate.
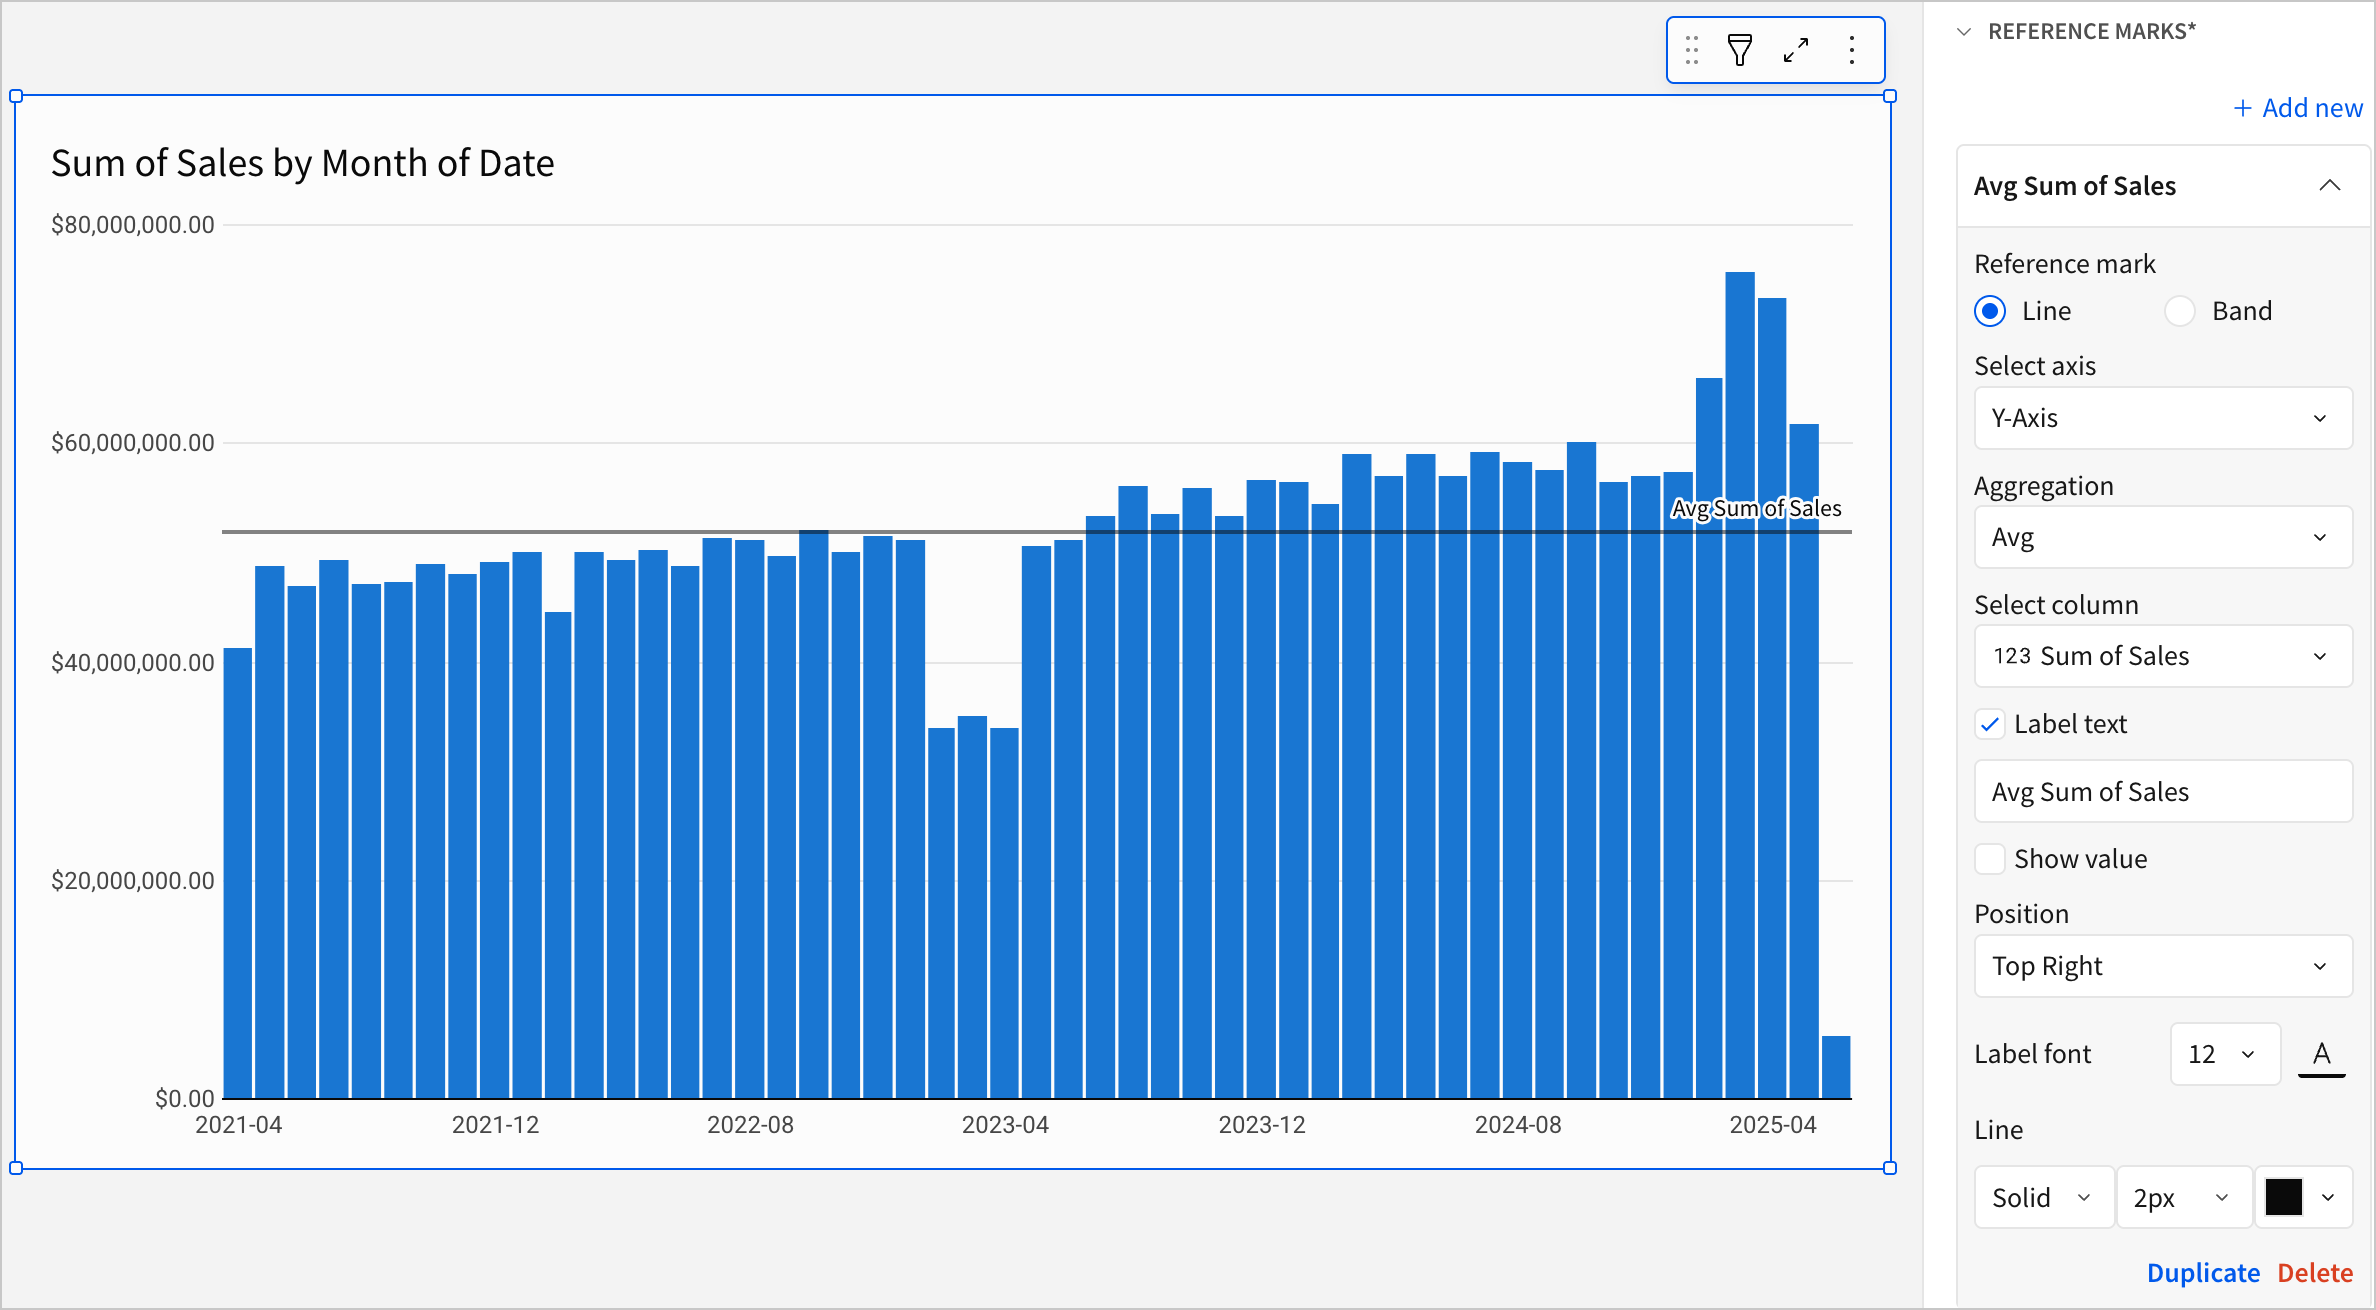
- (Optional) To customize the appearance of the line, configure any of the following optional settings:
Add a reference band
A reference band highlights a range between two values, such as an acceptable range or a confidence interval.
To plot a reference band, do the following:
-
Open a workbook or report for customizing or editing.
-
Select the chart you want to modify.
-
In the editor panel, select Format, then click Reference marks to expand the section.
-
Click + Add new.
-
For Line or band, select Band.
-
For Axis, select the axis you want to plot the band on.
-
For Band start, configure the value where the band begins:
- To use a fixed value, select Constant and enter the value you want to use.
- To calculate the value from your data, select an aggregate, such as Min, Max, Sum, or Avg, then select a column to aggregate.
-
For Band end, configure the value where the band ends, using the same options as Band start.
-
(Optional) To customize the appearance of the band, configure any of the following optional settings:
Duplicate a reference mark
To create a copy of an existing reference mark and its settings:
- In the Reference marks section of the Format tab, click the reference mark you want to duplicate.
- Select Duplicate. The popover for the duplicated reference mark opens.